Although non-vessel-operating common carriers (NVOs) captured a larger share of the total eastbound trans-Pacific container trade in the first eight months of 2020, the largest forwarders actually saw their share of NVO volumes slip.
The top 25 NVOs in the eastbound trans-Pacific handled 49.4 percent of the nearly 4.73 million TEU in US imports from Asia transported by NVOs during the first eight months of 2020, down from 49.6 percent in the same 2019 period, according to data from PIERS, a sister company of JOC.com within IHS Markit.
Thanks to an 8.9 percent jump in volume, San Francisco-based Apex Group overtook Expeditors International of Seattle, Washington, handling the largest combined share of US imports from Asia through August, followed by Expeditors and Eden Prairie, Minnesota-based C.H. Robinson, which reported volume declines of 9.6 percent and 4.4 percent, respectively.
But Expeditors and C.H. Robinson were not alone; a dozen of the top NVOs in the trade saw their volumes and market share decrease on a year-over-year basis during the period. The largest declines were registered by De Well of Vernon, California, which saw shipments in the eastbound trans-Pacific tumble 16.4 percent, Hong Kong’s MCL Multi Container Line and Essen, Germany-based DB Schenker, both of which were down 15.3 percent from the previous year.
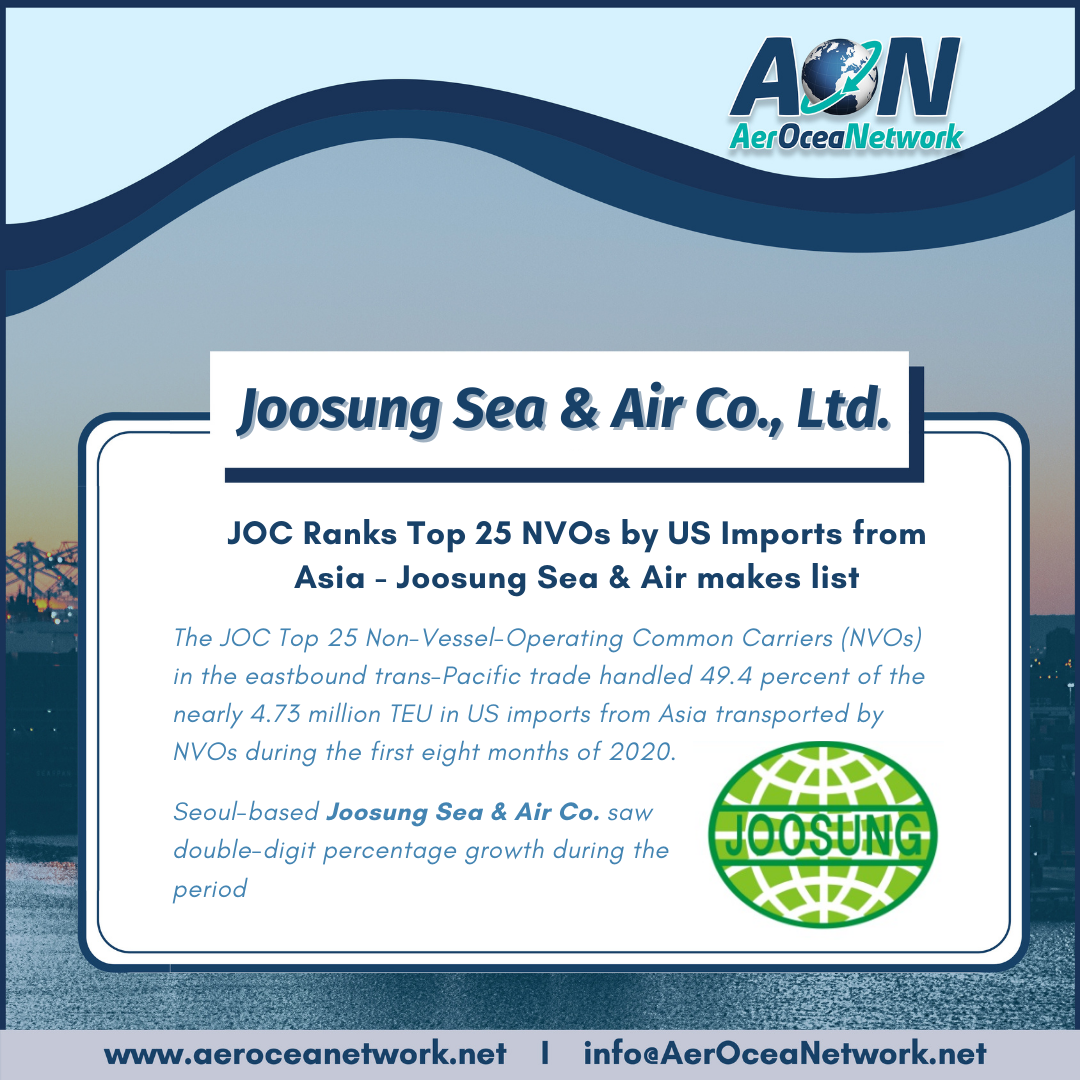
Still, several of the top 25 saw double-digit percentage growth during the period, including Hong Kong’s DT Logistics (up 35.5 percent), Honour Lane Shipping (up 12.6 percent), and Hecny Shipping (11.7 percent), Copenhagen-based DFDS Group (up 20.5 percent), Seoul-based Joosung Sea & Air Co. (up 19.6 percent), and Ningbo, China-based Safround logistics (up 15.4 percent).
The largest gain, however, was reported by relative newcomer Flexport, which saw volumes rocket 135 percent year over year to 55,808 TEU during the January–August period. Founded in 2015, San Francisco-based Flexport is one of a number of digitally focused forwarders that has entered the trans-Pacific market in recent years.
JOC.com’s Top 25 NVOs by US Imports from Asia rankings are compiled using data from PIERS. Volume figures are expressed in twenty-foot equivalent units (TEU). One standard 40-foot ocean container equals two TEU. Non-containerized cargoes — i.e., dry bulk, liquid bulk, roll-on/roll-off (ro-ro), and oversized/heavy-lift project freight — are not included.
Rankings compiled by Marcin Lejk, data analyst.
JOC Top 25 NVOs by US Imports from Asia
US IMPORTS FROM ASIA, Jan.-Aug. 2020 vs. Jan.-Aug. 2016, 2017, 2018, and 2019 in laden TEU
The JOC Top 25 Non-Vessel-Operating Common Carriers (NVOs) in the eastbound trans-Pacific trade handled 49.4 percent of the nearly 4.73 million TEU in US imports from Asia transported by NVOs during the first eight months of 2020, a decline of 0.2 percentage points from the same 2019 period but still up 0.8 percentage points from 2016.
| 2020 Rank | Non-vessel-operating common carrier |
TEU Volume Jan.–Aug. 2020 | Percent Volume Change vs Jan.–Aug. 2019 |
|
Percent Market Share Change vs Jan.–Aug. 2019 | ||||||||||||||
| 1 | Apex Group | 238,940 | 8.9% | 4.9% | 4.9% | 5.3% | 4.7% | 5.1% | 0.3% | ||||||||||
| 2 | Expeditors International | 220,255 | -9.6% | 5.7% | 5.6% | 5.3% | 5.2% | 4.7% | -0.6% | ||||||||||
| 3 | C.H. Robinson | 210,180 | -4.4% | 5.1% | 5.4% | 5.0% | 4.7% | 4.4% | -0.3% | ||||||||||
| 4 | OEC Group | 185,148 | -7.2% | 3.9% | 3.9% | 4.3% | 4.3% | 3.9% | -0.4% | ||||||||||
| 5 | Honour Lane Shipping | 166,254 | 12.6% | 3.0% | 3.1% | 3.1% | 3.2% | 3.5% | 0.3% | ||||||||||
| 6 | Kuehne + Nagel International | 160,886 | -1.3% | 3.4% | 3.6% | 3.5% | 3.5% | 3.4% | -0.1% | ||||||||||
| 7 | The Topocean Group | 128,664 | 8.6% | 2.6% | 2.5% | 2.7% | 2.5% | 2.7% | 0.2% | ||||||||||
| 8 | Hecny Shipping | 106,177 | 11.7% | 2.2% | 2.2% | 2.3% | 2.0% | 2.2% | 0.2% | ||||||||||
| 9 | DHL | 75,675 | -1.7% | 1.5% | 1.6% | 1.5% | 1.7% | 1.6% | -0.1% | ||||||||||
| 10 | China International Freight Co. |
69,447 | 8.9% | 1.3% | 1.5% | 1.5% | 1.4% | 1.5% | 0.1% | ||||||||||
| 11 | De Well | 69,290 | -16.4% | 1.9% | 2.0% | 1.8% | 1.8% | 1.5% | -0.3% | ||||||||||
| 12 | Orient Star Transport International Ltd. | 67,796 | 6.7% | 1.1% | 1.3% | 1.3% | 1.4% | 1.4% | 0.1% | ||||||||||
| 13 | SeaMaster Logistics, Inc. | 65,902 | -2.6% | 2.7% | 1.9% | 1.9% | 1.5% | 1.4% | -0.1% | ||||||||||
| 14 | MCL Multi Container Line | 60,898 | -15.3% | 1.1% | 1.3% | 1.4% | 1.5% | 1.3% | -0.3% | ||||||||||
| 15 | UPS Supply Chain Solutions Inc. | 58,795 | -10.7% | 1.7% | 1.5% | 1.3% | 1.4% | 1.2% | -0.2% | ||||||||||
| 16 | Flexport | 55,808 | 135.0% | 0.0% | 0.0% | 0.1% | 0.5% | 1.2% | 0.7% | ||||||||||
| 17 | DT Logistics (Hong Kong) Ltd. |
55,168 | 35.5% | 0.1% | 0.4% | 0.6% | 0.9% | 1.2% | 0.3% | ||||||||||
| 18 | DB Schenker | 54,839 | -15.3% | 1.3% | 1.5% | 1.4% | 1.4% | 1.2% | -0.2% | ||||||||||
| 19 | Safround logistics | 48,448 | 15.4% | 0.0% | 0.0% | 0.8% | 0.9% | 1.0% | 0.1% | ||||||||||
| 20 | DFDS Group | 44,868 | 20.5% | 1.0% | 1.2% | 0.8% | 0.8% | 0.9% | 0.1% | ||||||||||
| 21 | Pudong Prime International Logistics | 39,981 | 1.6% | 0.7% | 0.8% | 0.7% | 0.8% | 0.8% | 0.0% | ||||||||||
| 22 | Cohesion Freight (H.K.) | 39,195 | 0.0% | 0.8% | 0.7% | 0.7% | 0.8% | 0.8% | 0.0% | ||||||||||
| 23 | Translink Shipping | 38,702 | -13.5% | 1.0% | 1.1% | 1.1% | 1.0% | 0.8% | -0.1% | ||||||||||
| 24 | FedEx Trade Networks Transport & Brokerage |
38,454 | -10.5% | 1.0% | 1.0% | 1.0% | 0.9% | 0.8% | -0.1% | ||||||||||
| 25 | Joosung Sea & Air Co. | 37,115 | 19.6% | 0.3% | 0.3% | 0.5% | 0.7% | 0.8% | 0.1% | ||||||||||
| Total JOC Top 25 NVOs by US Imports from Asia |
2,336,886 | -1.8% | 48.6% | 49.3% | 49.9% | 49.6% | 49.4% | -0.2% | |||||||||||
| Total NVO US Imports from Asia | 4,728,488 | ||||||||||||||||||
*Data does not include imports through Canadian ports
Source: PIERS